Presentation of two new spatial statistical visualisation methods at the GISRUK conference in Leeds

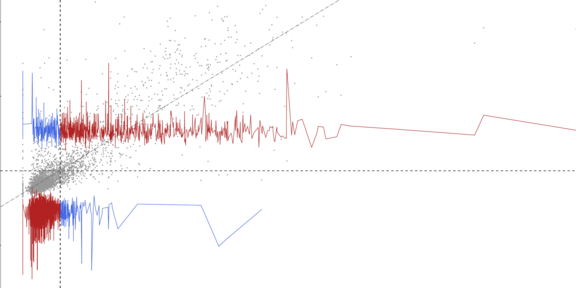
The intuitive visualisation of spatial statistical findings is not trivial, but it is important for drawing appropriate conclusions. This is why René Westerholt presented novel variants of the Moran scatterplot at the GISRUK conference in Leeds (UK), allowing better contextualisation of the spatial structures visualised in this plot.
The Moran scatterplot is a useful tool for exploring the spatial structure of datasets. The diagram plots spatial lags, that is, averaged spatial neighbourhoods, against their corresponding local attribute values. In simple terms, the plot shows us which high/low values are surrounded by other high/low values and where there are spatial outliers with corresponding discrepancies. In this way, differently characterised autocorrelation sectors and potential structural breaks can be identified. However, the Moran scatterplot does not provide easily identifiable indications of possible spatial weight misspecification and p values. Both are important information when exploring possible spatial structures. In the presented short paper, so-called Moran seismograms and Moran drop plots are introduced, which complement the Moran scatterplot and visualise both types of information mentioned. The work was presented at the 2024 GISRUK conference in Leeds, the national GIS conference for the UK and Ireland.
Westerholt, R. (2024): Extending the Moran scatterplot by indications of critical values and p-values: introducing the Moran seismogram and the drop plot. 32nd Annual GIS Research UK Conference (GISRUK), Leeds, UK. DOI: 10.5281/zenodo.10897792.

